
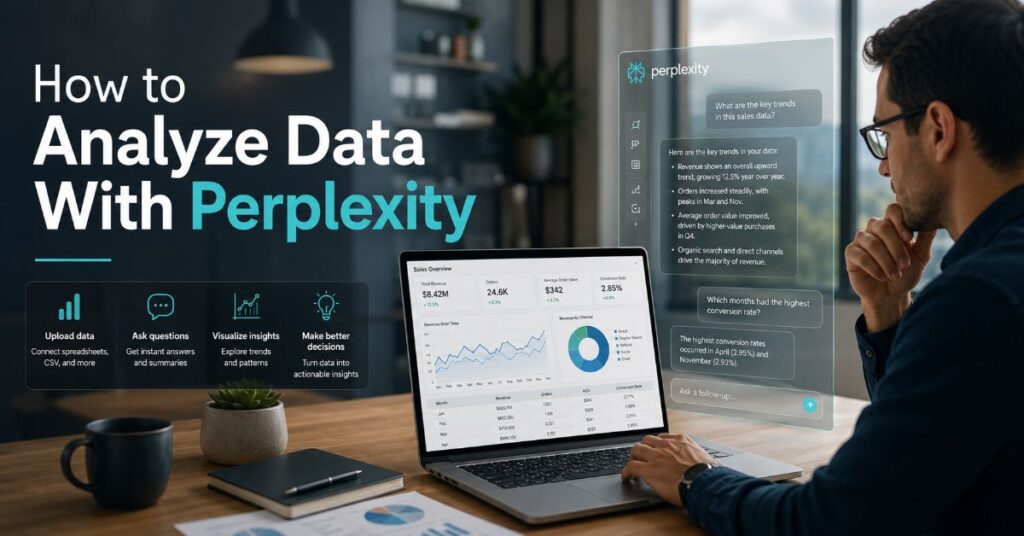
📋 Executive Summary
Capabilities: Perplexity can inspect uploaded files, answer follow up questions, create tables and charts and generate XLSX, DOCX, PDF, PPTX and HTML assets on eligible paid plans.
Workflow: The safest analysis process begins with a schema audit and row count ledger before requesting data cleaning, filtering, correlation or visualization.
File Limits: Official documentation lists a 40 MB general upload limit, while some paid Project and Enterprise features reference 50 MB uploads. Treat 40 MB as the safest working threshold.
Pricing: Perplexity Pro costs $20 per month or $200 annually, while Create files and apps usage is governed by monthly average use allowances instead of a fixed published limit.
Verification: Fluent analysis does not guarantee accurate analysis. Every important total, rate, date range, denominator and chart should be reconciled with the original dataset.
Best Fit: Perplexity is an excellent exploratory analyst and report builder, while SQL, Python, R and governed BI platforms remain the stronger choice for reproducible, high stakes and large scale analysis.
I approach how to analyze data with Perplexity as a controlled conversation with a fast junior analyst, not as a button that turns a spreadsheet into truth. That distinction matters because the platform can move from an uploaded CSV to a polished narrative, chart or downloadable spreadsheet with striking speed, while a wrong denominator or silently dropped row can remain hidden beneath fluent prose. The useful skill is designing an analysis trail that makes every number inspectable.
Perplexity can read attached files, maintain follow-up context and combine private material with web research. Create files and apps can produce spreadsheets, documents, presentations and simple applications. It sits between chat and a notebook: faster to start, but less transparent than rerunnable code.
This guide shows how to use that middle ground responsibly. You will learn how to prepare a dataset, define metrics, request cleaning, explore segments, test anomalies, create visualisations, validate outputs and export reusable assets. I also separate the current product surfaces, prices and limits because a one-off attachment, a Project file, a cloud connector and an Enterprise repository do not always follow the same rules.
The sharpest limitation is simple. Perplexity states that short files may be analysed in full, while long files can be reduced to the parts considered most relevant to the query. A convincing answer may therefore describe a sample rather than the complete dataset unless you force the workflow to prove coverage.
What Perplexity Can Actually Do With Data
Perplexity data analysis begins with file-aware conversation. You attach a file, ask a bounded question and refine the result through follow-ups. The official upload documentation supports text, code, PDFs, images, audio and video, while file connectors add common business formats such as Google Sheets, XLSX, CSV, JSON, DOCX and PPTX. The platform can transcribe audio and video speech, but it does not index the visual scenes inside video files.
For structured datasets, Perplexity can inspect a schema, summarise metrics, compare segments, detect candidate patterns and turn findings into tables, charts or exported assets. Eligible users can package work as XLSX, DOCX, PDF, PPTX or HTML.
A broader complete Perplexity AI guide is useful when you need the surrounding features, but data work depends on a narrower question: which analytical step is the system performing, and how will you verify it?
| Capability | Good Fit | Evidence You Should Request | Main Limitation |
| Schema inspection | Column names, likely types, date coverage, candidate identifiers | Column inventory, null counts, unique counts and sample values | Type inference may be wrong when values are inconsistent |
| Descriptive analysis | Totals, averages, rates, distributions and rankings | Formula definitions, denominators, row counts and date filters | A plausible summary can hide excluded or malformed records |
| Segment comparison | Channel, country, product, cohort or device comparisons | Group sizes, baseline values and absolute plus relative differences | Small groups can look important because of percentage volatility |
| Pattern detection | Trends, correlations, outliers and change points | Method used, threshold, comparison period and alternative explanations | Correlation language can be interpreted as causation |
| Asset creation | Spreadsheets, reports, charts, decks and simple dashboards | Downloadable output plus calculation notes | Generated formulas and charts still require inspection |
The key is to make Perplexity expose intermediate work. Do not begin with “find insights”. Begin with “show me what you think this file contains, then wait”. That pause prevents the platform from combining ingestion, cleaning, modelling and interpretation into one opaque leap.
Choose the Right Workspace Before You Upload
Perplexity now has several surfaces that can all appear to support data analysis, but they solve different problems. A standard Session is best for a one-off file and a focused chain of questions. A Project is better for recurring work because it keeps related Sessions, instructions and persistent files together. Create files and apps is the asset-building layer for reports, spreadsheets, presentations, dashboards and HTML tools. Connectors bring cloud files into a Session or, on eligible Enterprise plans, into Projects and organisation repositories.
For a monthly marketing report, a Project is usually the cleanest setup. Give it a specific name, such as “Paid Media Performance 2026”, and add instructions that remain stable across every run. A useful instruction block might define currency, timezone, attribution model, acceptable date format, minimum sample size and the exact formula for return on ad spend. This prevents each new Session from inventing its own analytical conventions.
The detailed guide to Projects and shared research workspaces explains the organisational layer. For analysis, the important distinction is persistence. Files attached to a temporary Session have retention rules, while files stored in Projects or repositories remain until deleted. Connected files may also inherit permissions from the original storage provider.
At launch, chief executive Aravind Srinivas said Labs could support work including “trading strategies” and “dashboards”, while Perplexity described it as “like having a team”. The current product language is Create files and apps, with preview, follow-up editing, version history and export.
Use a Session when the dataset is disposable, the question is narrow and you can validate immediately. Use a Project when definitions and files must persist. Use Create files and apps when the output itself matters. Use an Enterprise connector when governed access, automatic synchronisation and organisation-wide knowledge are more important than a manual upload.
Prepare the Dataset Before Perplexity Sees It
The quality of Perplexity data analysis is constrained by the dataset you provide. Rita Sallam, Distinguished VP Analyst at Gartner, warned in May 2026 that without a clear understanding of relationships and rules in organisational data, AI agents are more likely to “hallucinate, introduce bias and produce unreliable results”. That principle applies even to a modest CSV.
Start by preserving an untouched copy of the raw file. Create a second working copy and remove material the analysis does not require, especially personal identifiers, free-text secrets, authentication tokens or commercially sensitive notes. Rename ambiguous columns before upload. “Value” should become “order_revenue_gbp”; “Date” should become “order_created_date”; “Status” should state whether it means payment, fulfilment or campaign status.
Check whether the file has one rectangular table. Merged cells, decorative headings, inserted subtotals and repeated headers can break analysis. Export complex workbooks into one CSV per logical table and include a data dictionary for keys and joins.
The file upload workflow covers attachment mechanics. Before clicking Attach, complete this preparation checklist.
| Check | Why It Matters | Practical Fix |
| One row represents one observation | Mixed row meanings break aggregation | Separate summary rows from transaction rows |
| Dates use one format and timezone | Ambiguous dates distort trends | Convert to ISO format and state timezone |
| Numeric columns contain numbers only | Currency signs and commas can force text parsing | Store currency as numeric values with a separate currency field |
| Missing values are consistent | Blank, N/A, zero and “unknown” are not equivalent | Choose explicit missing-value rules |
| Categories use stable spelling | “UK”, “U.K.” and “United Kingdom” split groups | Standardise labels before upload |
| Identifiers are unique where expected | Duplicate keys can double-count totals | Test uniqueness and document legitimate duplicates |
| Units are explicit | Percent, basis points and decimals can be confused | Put units in column names or a data dictionary |
A powerful safeguard is a negative control. Add a harmless note in your prompt stating that the dataset does not contain a column named “predicted_profit”. Later, ask Perplexity whether that column exists. If it invents the field or calculates from it, stop the analysis. This simple test reveals whether the system is grounding itself in the attached schema or completing a familiar pattern from language alone.
How to Analyze Data With Perplexity: The Core Workflow
The most reliable workflow has seven passes. Each pass produces an artefact you can inspect before allowing the next one to begin.
Pass 1: Establish the Analysis Contract
Tell Perplexity the business question, the decision it will support and the definitions it must use. State the unit of analysis. A campaign-level file should not be treated as impression-level data. Define time boundaries, currency, timezone and inclusion rules. Ask the system to repeat the contract back in a compact list before analysing.
Pass 2: Audit the Schema
Request every column name, inferred type, missing count, distinct count and three representative values. Ask for minimum and maximum dates. Ask whether any columns appear constant, duplicated or derived from others. Do not request insights yet.
Pass 3: Create a Row-Count Ledger
Ask for the raw row count, then require a ledger after every transformation. If 50 duplicate rows are removed from 10,000 records, the next row count should be 9,950. If a filter produces 4,100 UK records, that count must remain attached to every UK-only result. This ledger is one of the most effective controls because it makes silent exclusions visible.
Pass 4: Clean With Explicit Rules
Ask Perplexity to propose cleaning actions, but require approval before execution. Separate exact duplicates from near duplicates. Distinguish missing values from true zeroes. Require a change log showing the affected column, rule, number of changed rows and examples before and after.
Pass 5: Calculate Baselines
Generate totals and weighted rates before searching for interesting patterns. For marketing data, calculate spend, impressions, clicks, conversions, revenue, click-through rate, conversion rate, cost per acquisition and return on ad spend. State every formula. Compare the generated totals with a trusted spreadsheet calculation.
Pass 6: Explore Segments and Exceptions
Only after reconciliation should you ask for rankings, trends, anomalies and correlations. Require group size and absolute values beside every percentage. Ask for at least one alternative explanation for each claimed pattern.
Pass 7: Package and Export
Ask for a final output that includes the analysis contract, cleaning log, row-count ledger, metric definitions, findings, limitations and validation status. The broader research workflow in Perplexity is helpful for source-led work, but dataset analysis needs this additional computational audit trail.
End each pass with “stop and wait for approval” so assumptions cannot change invisibly between ingestion and recommendation.
Prompt Patterns That Produce Auditable Results
A strong prompt is less about clever phrasing than about forcing useful evidence. Use role, context, task, constraints, output format and validation checks. A complete first prompt for a marketing CSV might read:
“You are supporting a digital marketing analyst. Inspect the attached CSV but do not clean or calculate insights yet. Return: (1) raw row and column count, (2) every column with inferred type, null count and unique count, (3) minimum and maximum date, (4) possible identifier columns, (5) three representative values per field, and (6) any parsing risks. Use PKR for currency only after confirming the file’s currency. Stop after the audit.”
The next prompt should define metrics rather than assume them:
“Propose formulas for CTR, CPC, conversion rate, CPA and ROAS using the available columns. For each metric, show numerator, denominator, treatment of zero denominators and whether aggregation must be weighted. Do not calculate until I approve.”
This prevents averaging row-level percentages when a weighted rate is required.
For cleaning, use a controlled request:
“List proposed cleaning operations. Separate exact duplicates, missing values, invalid dates, text in numeric fields and category standardisation. For every operation, show affected row count and two examples. Do not alter the data yet.”
For anomaly analysis, require method and context:
“Identify candidate outliers in conversion_rate and revenue. Use at least two methods, such as IQR and robust z-score. Show the threshold, record identifier, segment, date and raw component values. Do not label an observation an error unless the source data proves it.”
For interpretation, add a contradiction test:
“Give three findings and, for each, provide the strongest evidence against your interpretation. Distinguish observation, plausible explanation and recommendation.”
This structure mirrors good academic research verification because it separates what the data says from what the analyst infers. It also aligns with Lisa Su’s 2026 reminder that AI cannot decide “which problems are worth solving”. The system can surface statistical patterns, but the human still defines the decision, risk and consequence.
Clean Missing Values, Types and Duplicates Carefully
Data cleaning is where apparently small assumptions create large downstream errors. Perplexity can propose fixes quickly, but you should not accept a blanket instruction such as “clean obvious issues”. Obvious to whom, and according to which rule?
Missing values require column-specific treatment. A blank conversion count may mean zero, unavailable or not yet attributed. Request missingness by column and, where useful, by segment or period because concentrated gaps may reveal a tracking outage.
Type conversion also needs an audit. Dates such as 03/04/2026 are ambiguous between 3 April and 4 March. Currency strings may contain commas, symbols and negative values in parentheses. Percentage columns may mix 12%, 0.12 and 12. Require Perplexity to show the parsed rule and a sample of converted values. Reject any conversion that cannot be reversed or explained.
Duplicates should be divided into three categories. Exact duplicate rows are usually safe to flag. Duplicate identifiers may be valid when an order has multiple line items. Near duplicates can reflect legitimate updates, attribution windows or repeated events. Ask the system to identify the candidate key and explain why it believes a duplicate is accidental.
A useful output is a cleaning ledger:
| Step | Rule | Rows Affected | Rows Remaining | Validation |
| Raw import | No changes | 0 | 10,000 | File row count confirmed |
| Header removal | Remove repeated header records | 4 | 9,996 | Removed rows match column labels |
| Exact duplicate removal | All fields identical | 46 | 9,950 | Duplicate hash list retained |
| Date correction | Reject impossible dates | 12 flagged | 9,950 | No rows deleted without approval |
| Country standardisation | Map approved aliases | 318 | 9,950 | Frequency table reconciled |
Do not let cleaning overwrite evidence. Ask for the original value, cleaned value and rule identifier in separate columns. The clean table should be a derivative asset, not a replacement for the raw file.
Find Trends, Segments, Correlations and Anomalies
Once baselines reconcile, Perplexity becomes useful as an exploratory partner. Ask it to compare segments, but require both absolute and relative values. A campaign with 200% growth from one conversion to three conversions is less important than a 10% decline across 10,000 conversions.
For time-series analysis, specify granularity and comparison. Weekly data can hide daily volatility, while daily data can exaggerate noise. Ask for week-over-week, month-over-month and year-over-year comparisons only where the date range supports them. Require partial-period warnings, such as comparing the first 12 days of July with all 30 days of June.
For correlations, request a matrix only after deciding which variables are meaningful. Spend, impressions and clicks are mechanically related in advertising data, so a high correlation may add little. Ask for Pearson and Spearman where appropriate, sample size, missing-value treatment and a warning that correlation does not establish causation. Then ask the system to name potential confounders.
For anomalies, combine statistical and business rules. A robust z-score may identify unusual conversion rates, while a business rule may flag revenue without conversions or spend with zero impressions. Require the system to distinguish data-quality anomalies from genuine performance events.
A high-value prompt is:
“Rank anomalies by expected business impact, not statistical extremity alone. Show the raw values, segment baseline, method, possible data-quality cause, possible business cause and the next verification action.”
The site’s practical overview of data analysis tools in 2026 helps place Perplexity beside Python, R, SQL and BI platforms. That comparison matters because an AI assistant is good at proposing hypotheses and explaining patterns, while deterministic tools remain better at proving that the calculation is reproducible.
Researchers Adam Tauman Kalai, Ofir Nachum, Santosh Vempala and Edwin Zhang described hallucinations as “confident, plausible falsehoods” in a 2026 Nature paper. In data work, those falsehoods may not look like invented facts. They may appear as a smoothly worded explanation attached to a real chart whose grouping or denominator is wrong.
Build Tables, Charts and Reusable Assets
Create files and apps expands the workflow beyond chat. Perplexity’s July 2026 documentation says eligible Pro, Education Pro, Max, Enterprise Pro and Enterprise Max users can create documents, spreadsheets, presentations and apps. Supported export types include DOCX and PDF for documents, XLSX for spreadsheets, PPTX for presentations and HTML for apps. Users can preview assets, edit them through follow-up prompts, revisit version history and export supported formats to Google Drive when connected.
For tables, request one header row, explicit units, no merged cells and a calculation note. For charts, define axes, aggregation, filters, sorting and missing-value treatment. Replace “make a revenue chart” with a request that names the date field, period, exclusions, comparison series and reconciliation table.
Request a reconciliation table beside every visual. If the chart shows £1.2 million in June revenue, the underlying table should show the exact total and row count. Ask for chart titles that state the filter and period. Avoid dual axes unless the relationship genuinely requires them.
For spreadsheet assets, inspect formulas rather than relying on displayed values. Generated workbooks should contain a Raw Data sheet, a Clean Data sheet, a Definitions sheet, an Analysis sheet and a Validation sheet. Protect the raw sheet from edits. Include formula notes and checks that compare summary totals with source totals.
A useful division of labour is to gather and verify sources in Perplexity, then use another tool for extended drafting or transformation. The Perplexity versus ChatGPT Search workflow explores that hand-off. For numerical assets, the same principle applies: use Perplexity for rapid construction, then inspect the workbook in Excel, Google Sheets or a code environment before publication.
The unique advantage is iteration. You can say, “Add a validation sheet”, “change the chart to weekly”, or “include a Pakistan-only filter” without rebuilding the whole asset. The risk is that each revision can change hidden logic. Ask for a version note that lists every changed formula, filter and output.
Validate Every Number Before Acting
Validation is not a final glance. It is a parallel workflow that starts with ingestion and continues through export. Dan Klein, UC Berkeley professor and co-founder of Scaled Cognition, told Axios in May 2026 that AI systems are not “truth engines” but “plausibility engines”. That is an unusually useful mental model for conversational analytics.
Use four validation layers: reconcile arithmetic in another tool, test boundaries and zero denominators, trace a random sample from raw data to output, and ask Perplexity how the result could be wrong.
A robust validation prompt is:
“Create a validation report for every headline metric. Include source columns, formula, filters, raw row count, included row count, excluded row count, independent recomputation, difference and pass/fail threshold. Flag any result that cannot be independently reproduced.”
Then use a consistency test. Start a new Session, upload the same file and provide the same analysis contract. If the totals or findings differ, investigate before trusting either output. Repetition is not a guarantee, but large unexplained differences reveal sensitivity to context or hidden choices.
Another useful method is the impossible-request test. Ask for a breakdown by a field that does not exist, or request a date outside the file’s range. A grounded analyst should say the request cannot be completed. If the system manufactures an answer, the rest of the Session is compromised.
The 2025 study “Generative AI for Analysts” found richer reports and broader analytical methods after AI adoption, but also reported a 59% rise in forecast errors in its studied setting. The lesson is not that AI makes analysts worse. It is that additional information and methods can increase cognitive burden, making disciplined synthesis more important.
Pricing, Plans and Hidden Limits in 2026
Perplexity pricing is straightforward at the headline level and less precise at the usage-limit level. Consumer Pro is $20 per month or $200 per year. Education Pro is $10 per month for verified students and educators. Max is $200 per month or $2,000 per year. Enterprise Pro is $40 per month or $400 per year per seat. Enterprise Max is $325 per month or $3,250 per year per seat. Annual prices are available through the web and may differ from app-store billing.
Consumer Pro and Max allowances use terms such as “average use” and “advanced use” rather than fixed public quotas. Enterprise documentation is more explicit.
| Plan | Public Price | Data and Asset Features | Publicly Documented Caps Relevant to Analysis |
| Standard | Free | Basic search, limited file upload, very limited Pro Search | 3 Pro Searches per day and 1 Research query per month |
| Pro | $20 monthly or $200 yearly | Advanced models, increased uploads, Research, Create files and apps, up to 50 Project files | Monthly or weekly average-use limits are stated, but exact consumer caps are not fully published |
| Education Pro | $10 monthly with verification | Pro features plus education tools | Uses average-use limits; exact asset quota is not fully published |
| Max | $200 monthly or $2,000 yearly | Highest consumer access, more advanced model and asset usage, up to 500 Project files | Advanced-use limits are stated; exact consumer counts vary and are not fully public |
| Enterprise Pro | $40 monthly or $400 yearly per seat | Governance, repositories, connectors, Projects and asset creation | 400 Pro Searches weekly, 50 Research queries monthly, 80 browser-agent queries monthly, 50 file/app creations monthly and 100 Session file uploads weekly |
| Enterprise Max | $325 monthly or $3,250 yearly per seat | Highest Enterprise limits and up to 5,000 Project files | 4,000 Pro Searches weekly, 500 Research queries monthly, 800 browser-agent queries monthly, 500 file/app creations monthly and 1,000 Session file uploads weekly |
File size is another area where official pages describe different surfaces. The general File Uploads page states a 40 MB maximum for all file types. The Projects page says paid users can upload files up to 50 MB. Enterprise Session documentation also refers to uploads of up to 50 MB and as many as 30 files per upload. Treat 40 MB as the safest cross-surface limit unless your current account interface explicitly confirms a higher cap.
The API is separate. A Pro or Enterprise subscription does not include complimentary Sonar API credits, and API usage is billed independently. Do not design an automated pipeline on the assumption that a web subscription covers programmatic analysis.
Privacy, Connectors and Team Workflows
Uploaded data deserves the same governance as any other cloud analytics tool. Perplexity’s file privacy documentation says Session attachments are retained for 30 days, or seven days for Enterprise Pro users. Files stored in Projects, personal repositories and organisation repositories remain until deleted. A shared public Session can expose attached material to anyone with the link, so keep analytical Sessions private unless the dataset is safe to share.
Perplexity says connected files from services such as Google Drive and Dropbox are not used to train models. Enterprise plans state that organisation data is never used for model training. Consumer plans offer an opt-out setting rather than the same default contractual posture.
Current connector documentation covers Google Drive, Notion, Asana, Jira, Confluence, Gmail, Google Calendar and Slack for supported workflows. Enterprise connector collections also describe SharePoint, OneDrive, Box, Dropbox, Snowflake, GitHub, Linear and custom remote connectors through MCP. Availability, synchronisation and write actions vary by plan and connector. For example, Pro file connectors can select files for a Session, while automatic file synchronisation and Project-level connector use are positioned as Enterprise capabilities.
Connectors improve freshness and preserve provider permissions, but can obscure scope. Ask exactly which files, folders, tables or repositories contributed to an answer.
For team analysis, create a Project with a named owner, a documented metric dictionary and a review status. Use viewer access for stakeholders who should inspect outputs and contributor access only for people permitted to add files or change instructions. Export final evidence into a governed system rather than treating a chat thread as the system of record.
Minimise sensitive data before upload. Remove unnecessary personal fields, hash identifiers where possible and follow approved policy for regulated information.
When Perplexity Is Not the Best Tool
Perplexity is not the correct default for every analytical problem. It is strongest when the dataset is small or moderate, the task is exploratory, the user benefits from natural-language iteration and the output needs explanation or presentation. It is weaker when exact reproducibility, large joins, complex statistical inference, scheduled refreshes or governed semantic models are essential.
| Requirement | Best Primary Tool | Where Perplexity Helps | Why Perplexity Should Not Lead |
| Quick CSV exploration | Perplexity or spreadsheet | Schema audit, questions, summaries and charts | Validate before action |
| Complex joins and transformations | SQL or Python | Draft queries, explain logic and document results | Chat context is not a reliable transformation engine |
| Statistical modelling | R or Python | Hypothesis generation and plain-language explanation | Methods, diagnostics and random seeds need code-level control |
| Enterprise dashboards | Power BI, Tableau or Looker | Draft measures, narratives and stakeholder summaries | Governance, refresh and row-level security belong in BI |
| Systematic evidence extraction | Specialist research tools plus human review | Discovery, document questioning and synthesis | Citation support and extraction completeness need formal checks |
| Very large datasets | Warehouse, Spark or database engine | Define questions and summarise exported samples | Upload and context limits prevent full-scale processing |
A review of the best AI research tools by use case reinforces the broader point: tool choice should follow the method. Perplexity can be the fastest first analyst, but it should not replace a database, statistical package or governed BI layer when those are the actual requirements.
Use Python or R for reproducible modelling, SQL for warehouse data, spreadsheets for transparent small-scale logic and BI for governed refreshes and certified metrics.
Perplexity is often most valuable between these tools. It can help define the question before code is written, explain results after code runs, create a stakeholder report and identify follow-up checks. This is a complement model, not a replacement model.
A Complete Marketing Dataset Walkthrough
Consider a monthly Facebook Ads export for an e-commerce business with these columns: date, campaign_name, ad_set_name, country, platform, impressions, clicks, spend, purchases and purchase_value. The goal is to identify underperforming spend and recommend budget changes.
Begin with the analysis contract:
“Use one row as a campaign-day observation. Treat spend and purchase_value as PKR. Use Asia/Karachi dates. Define CTR as total clicks divided by total impressions, purchase rate as total purchases divided by total clicks, CPA as total spend divided by total purchases and ROAS as total purchase_value divided by total spend. Exclude no rows without approval.”
Next, request the schema audit and row-count ledger. Confirm the date range, detect missing campaign names, test whether spend is numeric and identify duplicate campaign-day rows. Ask for an inventory of countries and platforms. If the export contains an “All” summary row, remove it only after confirming that it duplicates detailed rows.
Approve cleaning rules. Standardise “Facebook”, “facebook” and “FB” only if they represent the same platform. Do not convert missing purchases to zero without understanding the export’s semantics. Preserve a cleaning log.
Calculate baseline totals and independently verify them. Suppose the source spreadsheet shows PKR 4,800,000 spend, 12,000 purchases and PKR 18,240,000 purchase value. The expected CPA is PKR 400 and ROAS is 3.8. If Perplexity reports 3.8 but its displayed totals differ, the agreement may be accidental. Require both formula and components.
Then compare country and platform using spend share, purchase share, CPA, ROAS and group size. Apply a minimum-spend threshold so tiny samples do not dominate rankings.
Analyse time trends using complete weeks. Flag days with spend but zero impressions, purchase value without purchases or sudden tracking changes. Ask whether anomalies cluster around platform, campaign or date.
Finally, request three budget actions. Each recommendation should include evidence, expected benefit, risk, confidence level and validation step. A defensible recommendation might say: “Reduce Campaign A by 15% for seven days because it represents 18% of spend but 7% of purchases, with CPA 2.4 times the account median across 4,300 clicks. Verify landing-page availability and attribution before making the change.”
Export an XLSX workbook with Raw Data, Clean Data, Definitions, Analysis, Anomalies, Recommendations and Validation sheets. Inspect formulas, compare totals and record approval.
Our Content Testing Methodology
This guide was tested as a feature workflow rather than treated as a generic product description. The evaluation separated standard file-aware Sessions, persistent Projects, Create files and apps, consumer file connectors and Enterprise connector surfaces. Official Perplexity documentation was cross-checked for supported file types, export formats, Project limits, upload retention, plan pricing and published quotas.
The analysis method used four controls that readers can reproduce: a schema audit, a row-count ledger, a metric-definition contract and an independent reconciliation step. Prompt patterns were designed to force intermediate evidence before interpretation. Negative controls included requesting a nonexistent column and an out-of-range date to test whether the system would refuse unsupported analysis.
Pricing was verified against Perplexity’s current plan documentation and billing pages available in July 2026. Where official pages described different file-size limits for general uploads, paid Projects and Enterprise Sessions, the article preserved the discrepancy and recommended the lower 40 MB threshold rather than presenting one universal figure.
Product claims about asset creation were checked against the July 16, 2026 Creating assets overview, including DOCX, PDF, XLSX, PPTX and HTML outputs, preview, version history, downloads and Google Drive export. Reliability guidance was cross-referenced with Gartner’s May 2026 statement on semantic context, the April 2026 Nature paper on confident guessing and 2025 research on AI-assisted analyst productivity and forecast error.
This article was researched and drafted with AI assistance and reviewed by the Sami Ullah Khan editorial desk at Perplexity AI Magazine. All data, citations, pricing figures, and named quotes have been independently verified against primary sources before publication.
Post-publication technical checks remain necessary. The WordPress page should return immediately to the prior page when the browser back button is pressed, without a redirect or reload loop. The published DOM should also be inspected for hidden text patterns such as display:none, visibility:hidden, zero-size text, background-matching text or large negative positioning.
Conclusion
Perplexity can make data analysis dramatically more accessible because it lets a user move from a file to a question, a chart and a report without building a complete technical stack. Its current asset tools, Project structure and connectors make it more capable than a simple question-answer interface. For exploratory work, stakeholder explanation and rapid first-pass analysis, that combination is genuinely useful.
The limit is not a lack of fluency. It is a lack of guaranteed transparency. Long files may be selectively extracted, consumer usage caps are not always expressed as fixed numbers, file-size rules differ by surface and generated formulas can look credible before they are checked. The correct response is not to avoid the tool. It is to design controls around it.
A good Perplexity analysis keeps the raw file untouched, defines the unit and formulas, records row counts after every transformation, reconciles headline metrics and tests whether the system refuses impossible requests. It also knows when to hand the job to SQL, Python, R or a governed BI platform.
The open question for conversational analytics is whether future interfaces will expose enough transformation history to make natural-language work as reproducible as code. Until then, Perplexity is best treated as a fast analytical collaborator whose work becomes trustworthy only after the human reviewer can trace every important conclusion back to the data.
Frequently Asked Questions
Can Perplexity Analyze CSV and Excel Files?
Yes. Perplexity supports CSV and XLSX through file uploads or supported connectors. It can inspect columns, summarise metrics, compare segments and create tables or charts. File support and limits vary by plan and upload surface, so large or complex workbooks should be simplified into clean tables before analysis.
What Is the Maximum File Size for Perplexity?
Perplexity’s general File Uploads documentation states a 40 MB maximum for all file types. Other official pages describe 50 MB limits for paid Project files and some Enterprise Session uploads. Use 40 MB as the conservative limit unless your current interface explicitly confirms a higher allowance.
Can Perplexity Clean a Dataset?
Perplexity can propose and apply cleaning steps such as duplicate removal, missing-value handling, type conversion and category standardisation. Require a change log, affected-row counts and before-and-after examples. Keep the raw file unchanged and independently validate the cleaned output.
Can Perplexity Create Charts and Dashboards?
Yes. Eligible paid users can use Create files and apps to generate charts, spreadsheets, reports, presentations and simple HTML applications. Every chart should include an underlying reconciliation table, clear filters, units and date range. Inspect generated formulas and totals after export.
Is Perplexity Accurate for Data Analysis?
It can be accurate, but accuracy depends on file parsing, metric definitions, prompt clarity and validation. Perplexity may extract selected sections from long files, and fluent explanations can conceal wrong assumptions. Reconcile important outputs in Excel, SQL, Python or R before making high-impact decisions.
Is Perplexity Better Than ChatGPT for Data Analysis?
Perplexity is strong when analysis benefits from web research, visible citations and rapid file-to-report workflows. ChatGPT may be stronger for extended reasoning, coding and transformation in some workflows. Neither should replace deterministic tools for reproducible calculation. The better choice depends on data size, governance and output requirements.
Does Perplexity Use Uploaded Files for Training?
Perplexity says connected files are not used for model training. Enterprise organisation data is not used for training by default, while consumer users have privacy settings that can opt out of AI data retention. Review current settings and organisational policy before uploading sensitive information.
Can Perplexity Analyze Large Datasets?
Perplexity is better suited to small and moderate files than warehouse-scale data. Large datasets may exceed upload or context limits, and long files may be selectively extracted. Use SQL, Python, R, Spark or a data warehouse for large-scale processing, then give Perplexity validated summaries or samples for explanation.
References
Perplexity Support. (2026, May 1). File uploads. Perplexity Help Center.
Perplexity Support. (2026, July 16). Creating assets with Perplexity: Overview. Perplexity Help Center.
Perplexity Support. (2026, July 17). Which Perplexity subscription plan is right for you?. Perplexity Help Center.
Perplexity Support. (2026, May 1). Security and privacy with file uploads. Perplexity Help Center.
Perplexity Support. (2026). What are Projects?. Perplexity Help Center.
Sallam, R. (2026, May 11). Gartner says lack of semantics causes inaccurate AI agents and wasted spending. Gartner.
Kalai, A. T., Nachum, O., Vempala, S. S., & Zhang, E. (2026). Evaluating large language models for accuracy incentivizes hallucinations. Nature, 653, 1047-1051.
Perplexity Team. (2025, May 29). Introducing Perplexity Labs. Perplexity.
Xue, J., Zhang, Q., & Zhu, W. (2025). Generative AI for analysts. arXiv.