When I look at searches for “TNA stock,” I see a pattern that repeats every market cycle. Investors are not asking about a company’s earnings or leadership. They are asking whether this moment is right for a bold, high-octane bet on U.S. small-cap stocks. TNA, formally Direxion Daily Small Cap Bull 3X Shares, exists precisely for that instinct. It is designed to deliver three times the daily return of the Russell 2000, the benchmark index for smaller U.S. companies.
As of late January 2026, TNA trades around $54 per share, well above its early-year lows near $18 and not far from a recent high above $60. Those numbers alone capture why TNA attracts attention. Few widely traded ETFs can triple in price within a year and still feel routine to seasoned traders. But that same volatility explains why TNA is misunderstood and frequently misused.
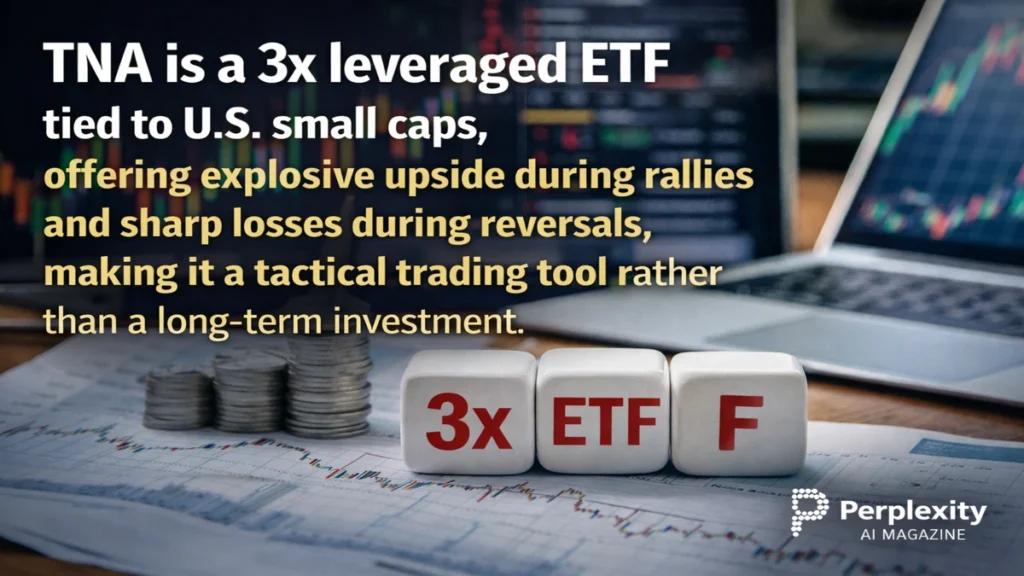
I have found that most confusion around TNA comes from a single assumption: that strong small-cap performance over months or years will automatically translate into gains for a 3x leveraged ETF. That assumption is wrong. TNA is engineered for daily performance, not long-term compounding. Its success depends on timing, trend persistence, and disciplined risk management. This article explains what TNA is, how it works, what drives its price in 2026, and why it should be treated as a tactical instrument rather than a buy-and-hold investment.
What TNA Is and How It Works
TNA is not a stock. It is a leveraged exchange-traded fund designed to provide three times the daily return of the Russell 2000 Index. If the Russell 2000 rises 1 percent in a single trading day, TNA aims to rise about 3 percent that day, before fees and expenses. If the index falls 1 percent, TNA aims to fall about 3 percent.
The most important word in that description is daily. TNA resets its leverage at the end of every trading session. Each morning, it begins again with the same objective: deliver approximately three times that day’s move. It does not seek to deliver three times the return over a week, month, or year.
This daily reset is achieved through derivatives such as swaps and futures. The structure allows TNA to deliver magnified exposure without requiring investors to trade on margin directly. It also introduces compounding effects that can significantly alter outcomes over time, especially in volatile markets.
The 2026 Price Snapshot in Context
In late January 2026, TNA trades around $54.40 per share. Over the prior year, it has ranged from roughly $18 to more than $60. That swing is not an anomaly. It is typical behavior for a 3x leveraged ETF tied to small-cap stocks, which are themselves more volatile than large-cap equities.
Technically, TNA is trading above both its 50-day and 200-day moving averages, suggesting short-term bullish momentum following a deep drawdown in 2025. For momentum traders, this configuration often signals opportunity. For long-term investors, it is largely irrelevant.
Price alone does not determine whether TNA is attractive. What matters is the underlying environment for small-cap stocks and whether that environment is likely to persist long enough for daily leverage to work in the investor’s favor.
Why “TNA Stock” Is a Popular Search Term
The keyword “tna stock” is driven almost entirely by retail interest. Traders search it to check live prices, charts, and volatility. Others are comparing it with IWM, the unleveraged Russell 2000 ETF, or asking whether TNA can outperform broader indexes like the S&P 500 during certain phases of the cycle.
This search behavior reflects how TNA is actually used. It is not a core holding. It is a directional tool. People search for it when they believe small-cap stocks are about to rally or when they want to understand why a recent move was so dramatic.
The Russell 2000 Connection
TNA’s performance is directly tied to the Russell 2000, which tracks approximately 2,000 small-cap U.S. companies. Small caps tend to be more sensitive to economic expectations, interest rates, and credit conditions than large-cap stocks.
In 2026, optimism around economic resilience and potential easing in monetary policy has supported periods of small-cap strength. When small caps outperform large caps, leveraged products like TNA can move rapidly.
At the same time, small caps are quick to sell off when growth expectations weaken. TNA magnifies those moves as well, making it unsuitable for investors who cannot tolerate sharp drawdowns.
Volatility and the Cost of Leverage
The defining risk of TNA is not leverage alone, but how leverage interacts with volatility over time. Because TNA resets daily, its returns over multiple days depend on the path the Russell 2000 takes, not just where it starts and ends.
In a strong, steady uptrend, TNA can deliver outsized gains. In a choppy market with frequent reversals, the same daily resets can erode value through compounding. This phenomenon, often called volatility drag, explains why leveraged ETFs can underperform expectations even when the underlying index trends modestly higher.
This is not a defect. It is a mathematical consequence of daily leverage.
TNA Versus IWM
Comparing TNA with IWM highlights its purpose.
| Feature | TNA | IWM |
|---|---|---|
| Exposure | 3x daily Russell 2000 | 1x Russell 2000 |
| Volatility | Very high | Moderate |
| Time horizon | Short term | Short to long term |
| Risk profile | Speculative | Core exposure |
IWM is designed to track small caps over time. TNA is designed to magnify daily moves. Confusing the two leads to poor outcomes.
How Traders Typically Use TNA
TNA is most effective when used in short-term, trend-following strategies. Traders often enter positions when the Russell 2000 breaks above resistance or shows accelerating momentum. Positions are typically sized small, often 1 to 5 percent of a portfolio, due to the leverage involved.
Day traders and swing traders also use TNA during periods of strong risk-on sentiment, such as after favorable economic data or central bank signals. In these scenarios, TNA can deliver rapid gains, but those gains can disappear just as quickly if momentum fades.
Hedging and Paired Strategies
Some traders use TNA alongside its inverse counterpart, TZA, to hedge or switch exposure based on trend signals. For example, a trader might hold TNA during uptrends and move into TZA during sharp sell-offs.
These paired strategies require active management and clear rules. They are not passive approaches. Without discipline, leverage can magnify mistakes.
Key Drivers of TNA in 2026
Several factors are shaping TNA’s price movements in 2026. The most important is small-cap momentum. When the Russell 2000 outperforms large-cap indexes, TNA tends to surge.
Macroeconomic expectations also matter. News related to interest rates, inflation, and growth disproportionately affects small caps. Federal Reserve signals that support risk-taking often lead to sharp moves in TNA.
Options activity plays a role as well. TNA is heavily traded in the options market, and large flows around expirations can amplify intraday volatility.
Risks That Define TNA Stock
TNA’s risks are straightforward but severe. The first is leverage risk. Losses are magnified just as gains are. The second is timing risk. Entering too early or holding too long can negate correct directional calls.
The third risk is psychological. TNA’s speed can encourage emotional trading. Without predefined exits, traders may hold losing positions longer than intended or give back gains during reversals.
A Practical Behavior Table
| Market Condition | Russell 2000 | TNA Outcome |
|---|---|---|
| Strong uptrend | Rising steadily | Large gains |
| Sideways market | Choppy | Gradual decay |
| Sharp correction | Falling fast | Rapid losses |
| Volatile swings | Up and down | Unpredictable erosion |
This table illustrates why environment matters more than conviction.
Expert Perspectives on Leveraged ETFs
Market educators consistently stress that leveraged ETFs are tools, not investments. They are designed to solve specific short-term problems, not to build long-term wealth.
Small-cap strategist Tom Lee has noted that leveraged exposure works best when trends are clear and momentum is sustained. That insight aligns closely with how TNA behaves in practice.
Rules Experienced Traders Follow
Traders who use TNA successfully tend to follow simple rules. They define their holding period in advance. They size positions conservatively. They use stop-losses and profit targets rather than relying on hope.
They also avoid holding TNA through uncertain, low-volatility periods when daily resets quietly erode value.
Takeaways
• TNA is a 3x leveraged ETF tied to daily Russell 2000 moves
• It is designed for short-term trading, not long-term holding
• Small-cap momentum is the primary driver of performance
• Volatility and daily resets can erode returns over time
• Strict risk management is essential
• Best suited for experienced traders
Conclusion
TNA represents the appeal and danger of leverage in a single ticker. When small-cap stocks rally decisively, it can deliver gains that feel extraordinary. When momentum fades, it can erase those gains just as quickly. The product does exactly what it is designed to do, but that design demands respect.
For traders who understand daily leverage and are willing to manage risk actively, TNA can be a powerful tool. For investors looking for long-term exposure to small caps, it is the wrong instrument. The difference between success and failure with TNA is not predicting the economy. It is understanding time, volatility, and discipline.
Frequently Asked Questions
Is TNA a stock or an ETF?
TNA is a leveraged ETF, not a company stock.
Is TNA suitable for long-term investing?
No. Daily leverage and compounding make it unsuitable for buy-and-hold strategies.
What index does TNA track?
It targets three times the daily return of the Russell 2000.
Why is TNA so volatile?
It uses 3x leverage and tracks small-cap stocks, which are inherently volatile.
When does TNA perform best?
During strong, sustained small-cap rallies over short periods.