Baseball has always been a numbers sport. Batting average, RBIs, home runs — generations of fans grew up treating these as the definitive measure of offensive worth. Then the sabermetrics movement arrived, and a cleaner, more complete picture began to take shape.
OPS — On-base Plus Slugging — is now one of the most widely cited statistics in Major League Baseball. It appears on broadcasts, in front offices, and in trade discussions because it does something batting average cannot: it captures both a player’s ability to reach base and their ability to hit for power in a single number.
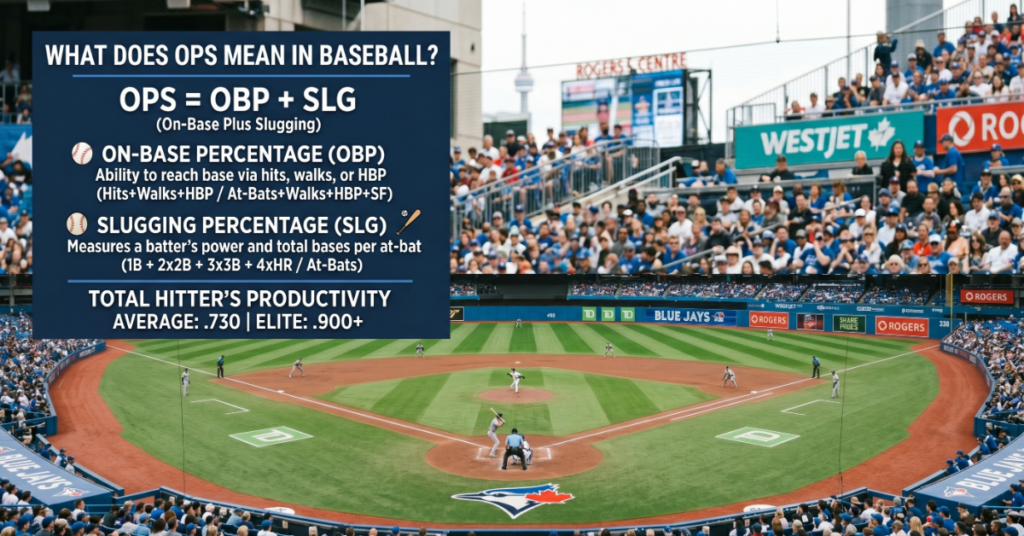
The formula is straightforward: OPS = OBP + SLG. Add the two percentages together, and you get a composite offensive score that is far more telling than any single traditional stat.
Breaking Down the Two Components
On-Base Percentage (OBP)
On-base percentage measures how often a batter reaches base safely per plate appearance. It includes hits, walks, and hit-by-pitch — but not errors or fielder’s choices.
Formula: OBP = (Hits + Walks + Hit by Pitch) divided by (At-Bats + Walks + Hit by Pitch + Sacrifice Flies)
A player with an OBP of .350 reaches base in 35% of their plate appearances. Elite OBP numbers push toward .400 and above.
Slugging Percentage (SLG)
Slugging percentage measures the average number of bases a batter earns per at-bat, rewarding extra-base hits more heavily than singles. Formula: SLG = Total Bases divided by At-Bats. A single = 1 base, double = 2, triple = 3, home run = 4.
| OPS Range | Classification | Example Level |
| .900 and above | Elite | MVP-caliber season |
| .800–.899 | Above average | Quality starter |
| .700–.799 | Average | Lineup contributor |
| .600–.699 | Below average | Fringe starter |
| Below .600 | Poor | Significant liability |
Why OPS Replaced Batting Average as the Standard
Batting average divides hits by at-bats. That’s it. It does not account for walks, which have the same run-scoring value as a single. It does not distinguish between a single and a home run. Two players with a .300 batting average can have radically different offensive value.
The sabermetrics movement demonstrated that on-base percentage was a significantly undervalued skill in the traditional scouting framework. OPS formalized that insight into a single, accessible number. Today, every MLB front office tracks OPS.
The Key Flaw in OPS: Unequal Weighting
Research in baseball statistics consistently shows that on-base percentage is approximately 1.8 times more valuable than slugging percentage in predicting run production. OPS adds the two metrics together as if they are equal — which overstates the contribution of slugging and understates the contribution of reaching base.
This is why OPS+ and wRC+ (Weighted Runs Created Plus) exist. Both attempt to correct for the distortions that raw OPS introduces.
| Stat | What It Adjusts For | Complexity Level |
| OPS | Nothing — raw sum | Low |
| OPS+ | Ballpark, league average | Moderate |
| wRC+ | Park, league, run environment | High |
| WAR (Offense) | All above + position, defense | Very high |
OPS Against: Using the Stat to Evaluate Pitchers
When applied to a pitcher, OPS becomes OPS Against — the combined on-base and slugging percentages that the pitcher has allowed to opposing batters. A starting pitcher with an OPS Against below .700 is performing well above average. Elite pitching performances push toward .600 and below.
The Future of OPS in Baseball Analysis in 2027
OPS is unlikely to disappear — it is too embedded in broadcast culture and fan literacy to be displaced by more complex metrics anytime soon. By 2027, the integration of Statcast tracking data into publicly accessible platforms is expected to push metrics like exit velocity, barrel rate, and expected slugging percentage into mainstream conversation.
The likely outcome is not OPS being replaced, but OPS being contextualized. A broadcaster will cite a player’s .850 OPS alongside their expected OPS — a Statcast metric — to give viewers both the results number and the process number simultaneously.
Takeaways
- OPS is calculated by adding on-base percentage (OBP) and slugging percentage (SLG) — two of the most predictive offensive metrics in baseball.
- An OPS of .800 or above is considered good; .900 and above is elite; below .700 signals offensive struggles.
- OPS outperforms batting average because it captures plate discipline (walks) and power (extra-base hits) simultaneously.
- The primary technical flaw in OPS is equal weighting — OBP is roughly 1.8 times more predictive of run production than SLG.
- OPS Against applies the same formula to pitchers, measuring the combined OBP and SLG a pitcher surrenders.
- Statcast-era metrics like expected OPS and barrel rate are beginning to complement OPS in mainstream baseball coverage.
Conclusion
OPS earned its place in the baseball conversation because it answers a question batting average cannot: how dangerous is this hitter, really? By combining the discipline to reach base with the power to advance runners, it captures the two things an offense needs most. For anyone watching baseball and wanting a single number that actually tells the story of a hitter’s value, OPS is still the right place to look.
FAQ
What does OPS stand for in baseball?
OPS stands for On-base Plus Slugging. It is calculated by adding a player’s on-base percentage (OBP) to their slugging percentage (SLG), producing a single number that measures overall offensive performance.
What is a good OPS in baseball?
An OPS of .800 or above is generally considered above average. Elite offensive seasons push above .900. An OPS below .700 typically signals a player who is struggling offensively.
Why is OPS better than batting average?
Batting average only counts hits and divides by at-bats. It ignores walks — which have the same run-scoring value as singles — and treats all hits equally. OPS accounts for walks, extra-base hits, and plate discipline, making it a far more complete offensive picture.
What is OPS Against in baseball?
OPS Against is the same metric applied to a pitcher — it measures the combined on-base percentage and slugging percentage that a pitcher has surrendered to opposing batters. A lower OPS Against indicates a more dominant pitching performance.
Is OPS the best offensive statistic in baseball?
OPS is widely used and accessible, but not the most technically accurate. Weighted Runs Created Plus (wRC+) is considered more reliable by analysts because it corrects for ballpark factors, era, and run environment with greater precision.
Methodology
Statistical definitions and thresholds were cross-referenced against the official MLB Glossary and published sabermetric research. Limitation: OPS benchmarks are league-era dependent. AI disclosure: This article was drafted with AI assistance and reviewed by the editorial team at Perplexityaimagazine.com.